LinkedIn Analytics | 2 min read
Improve your content without additional costs using LinkedIn native analytics.
Learning from your data is the most effective way to improve over time, and LinkedIn’s analytics offer everything you need in order to make the right adjustments to your content.
Step 1:
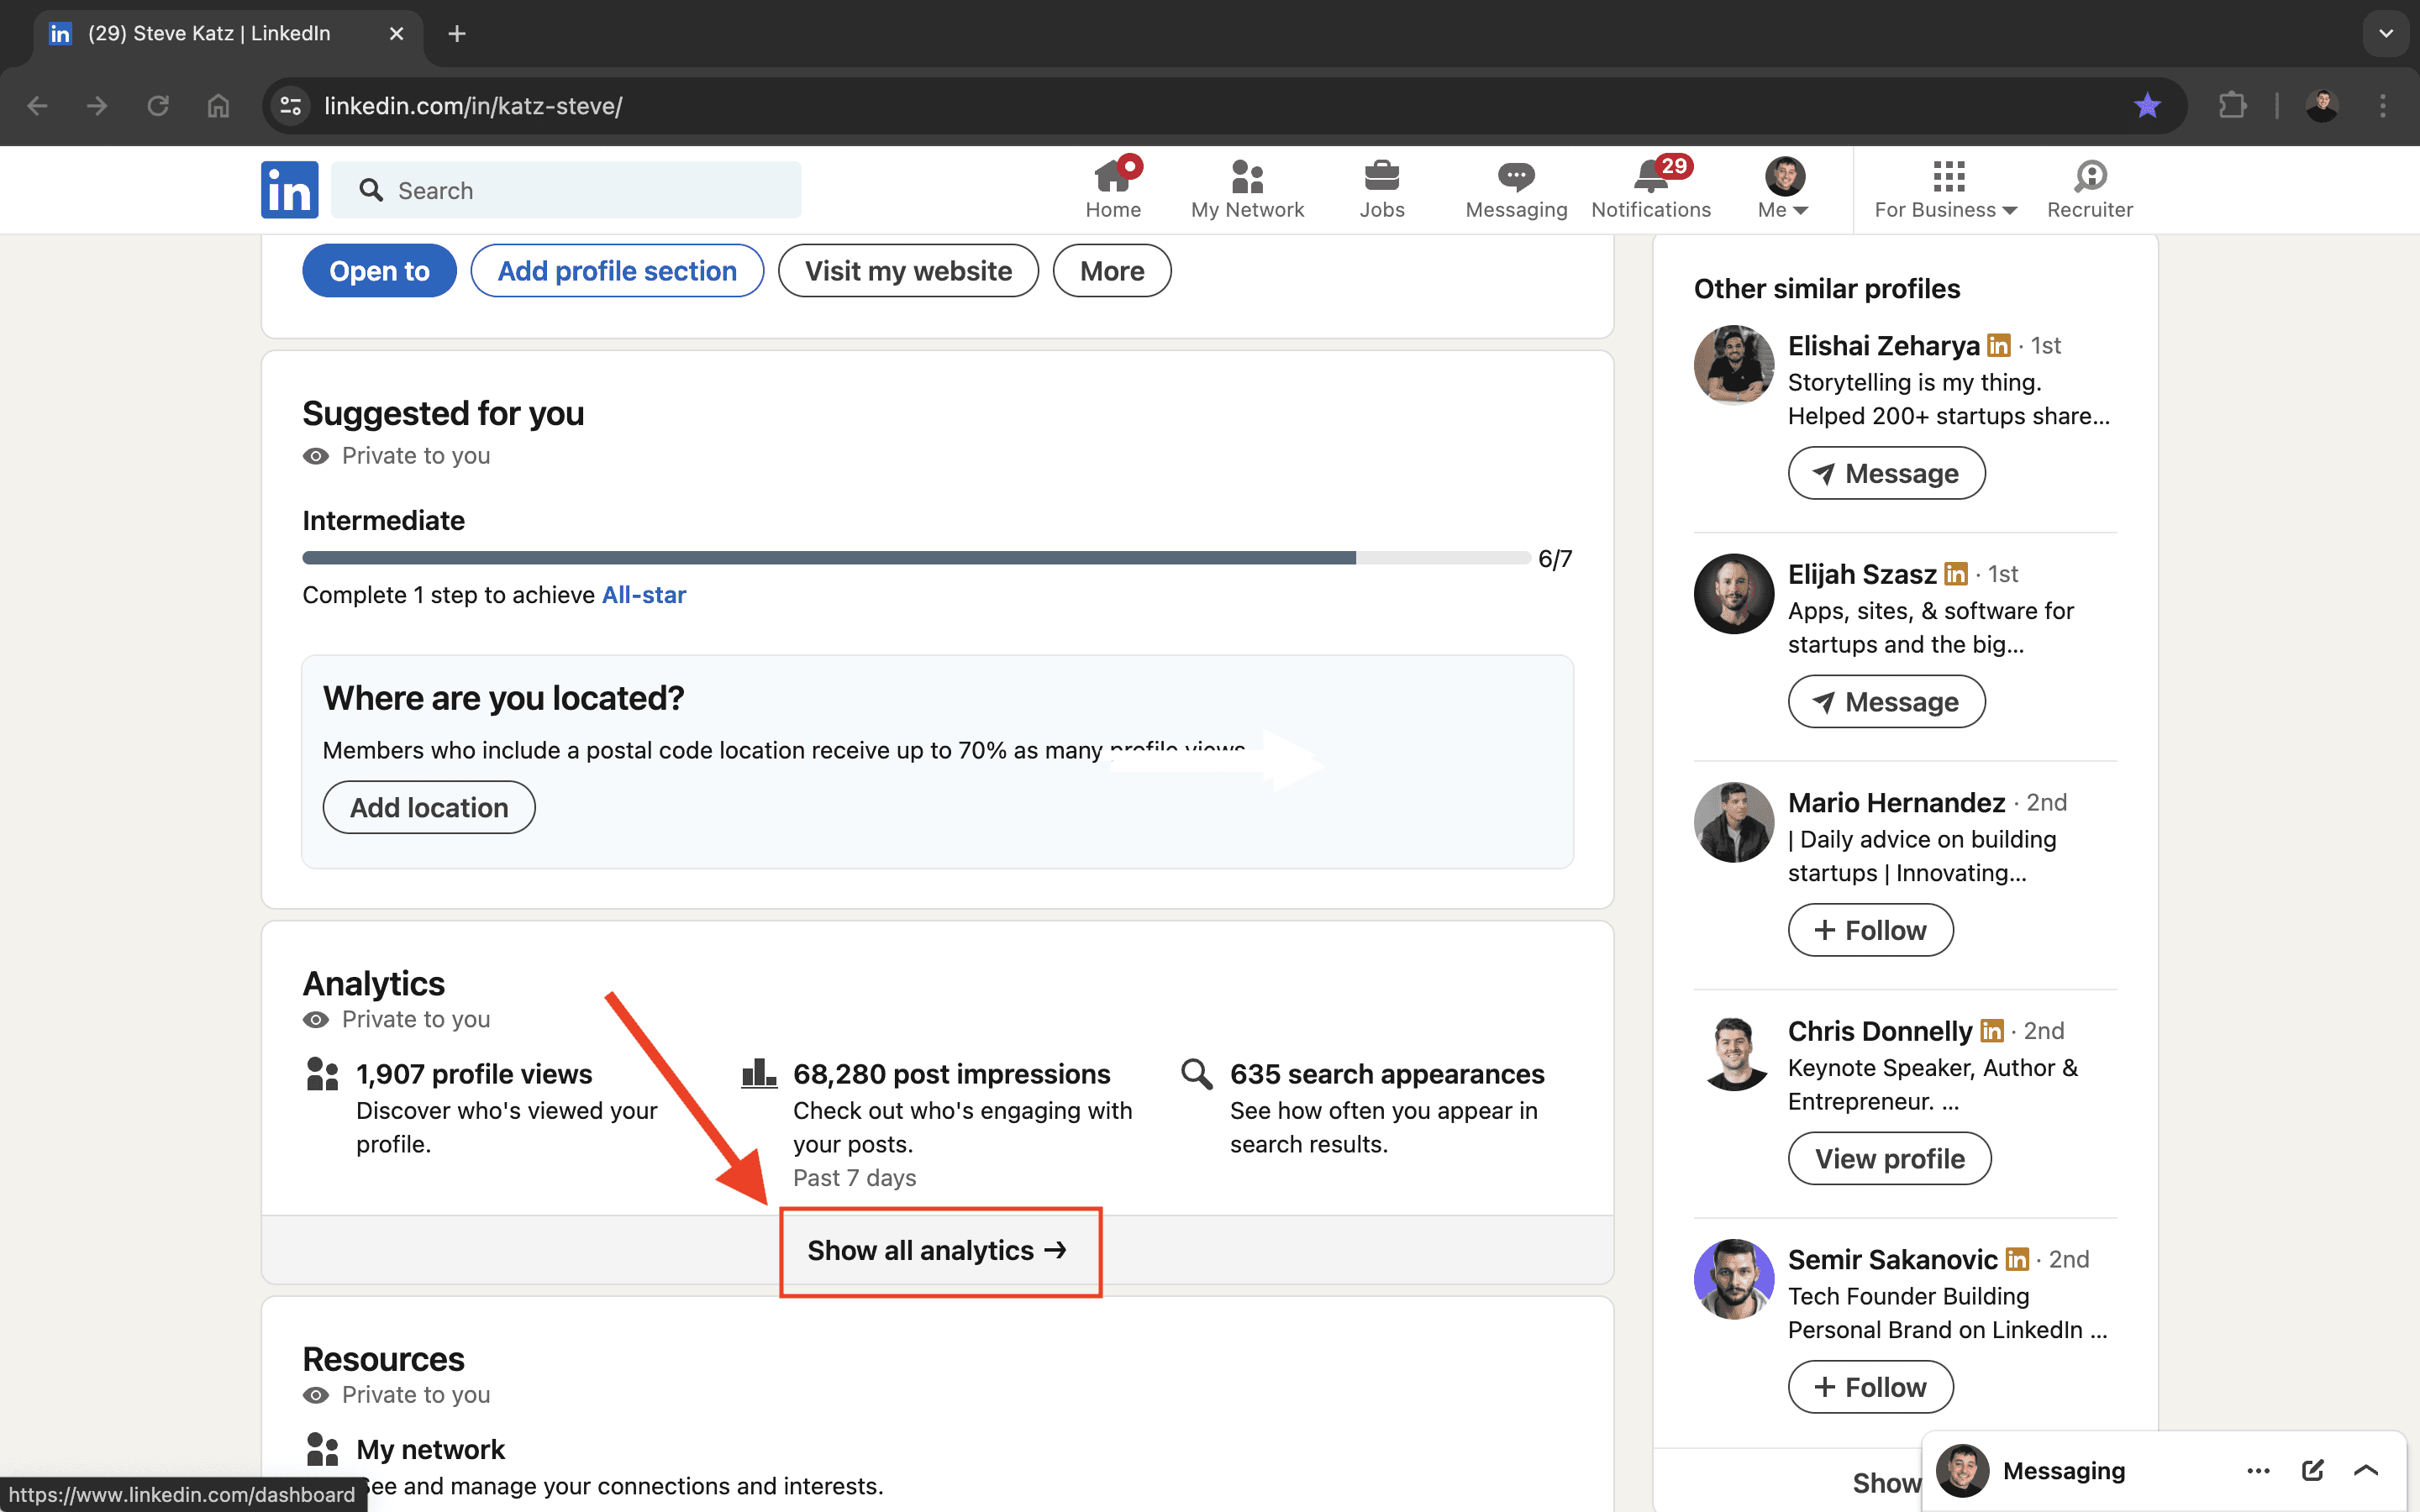
To navigate to the analytics, open your LinkedIn profile and see the first section directly underneath the intro section at the top, then click “Show all analytics →”.
Step 2:
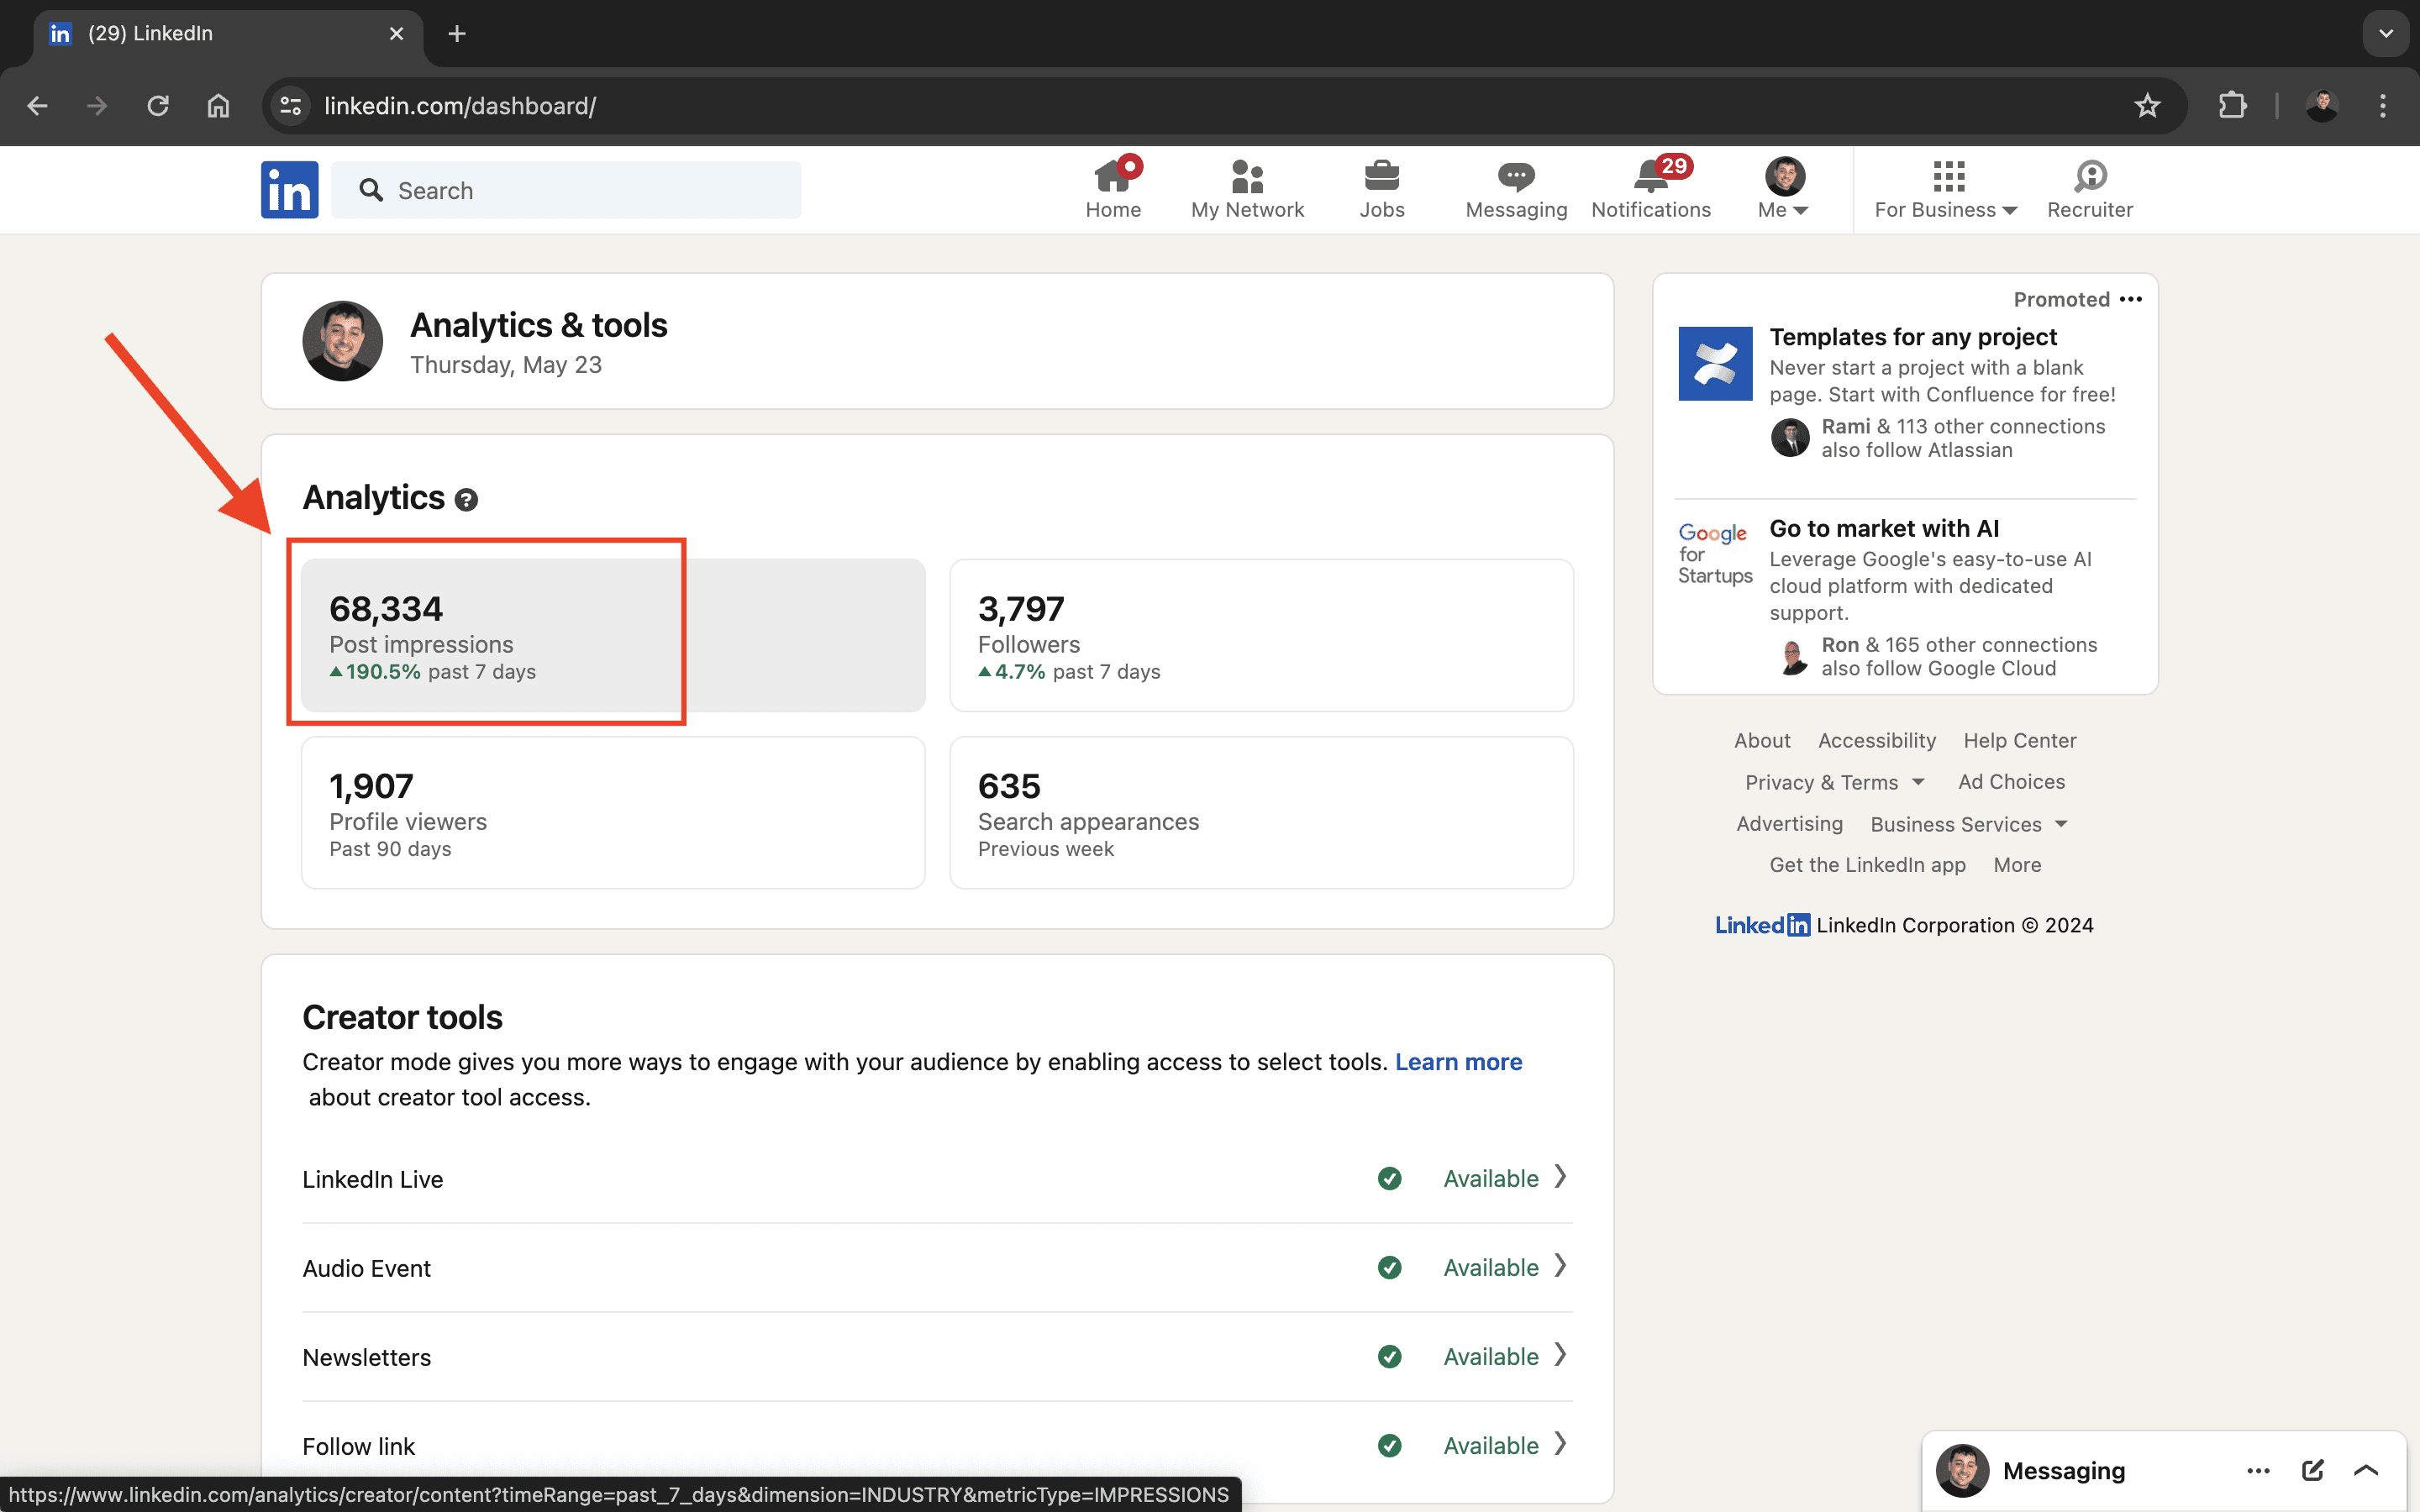
The initial display features four sections:
Post impressions (total post views)
Followers
Profile viewers
Search appearances
All self-explanatory.
Click on “post impressions”.
Step 3:
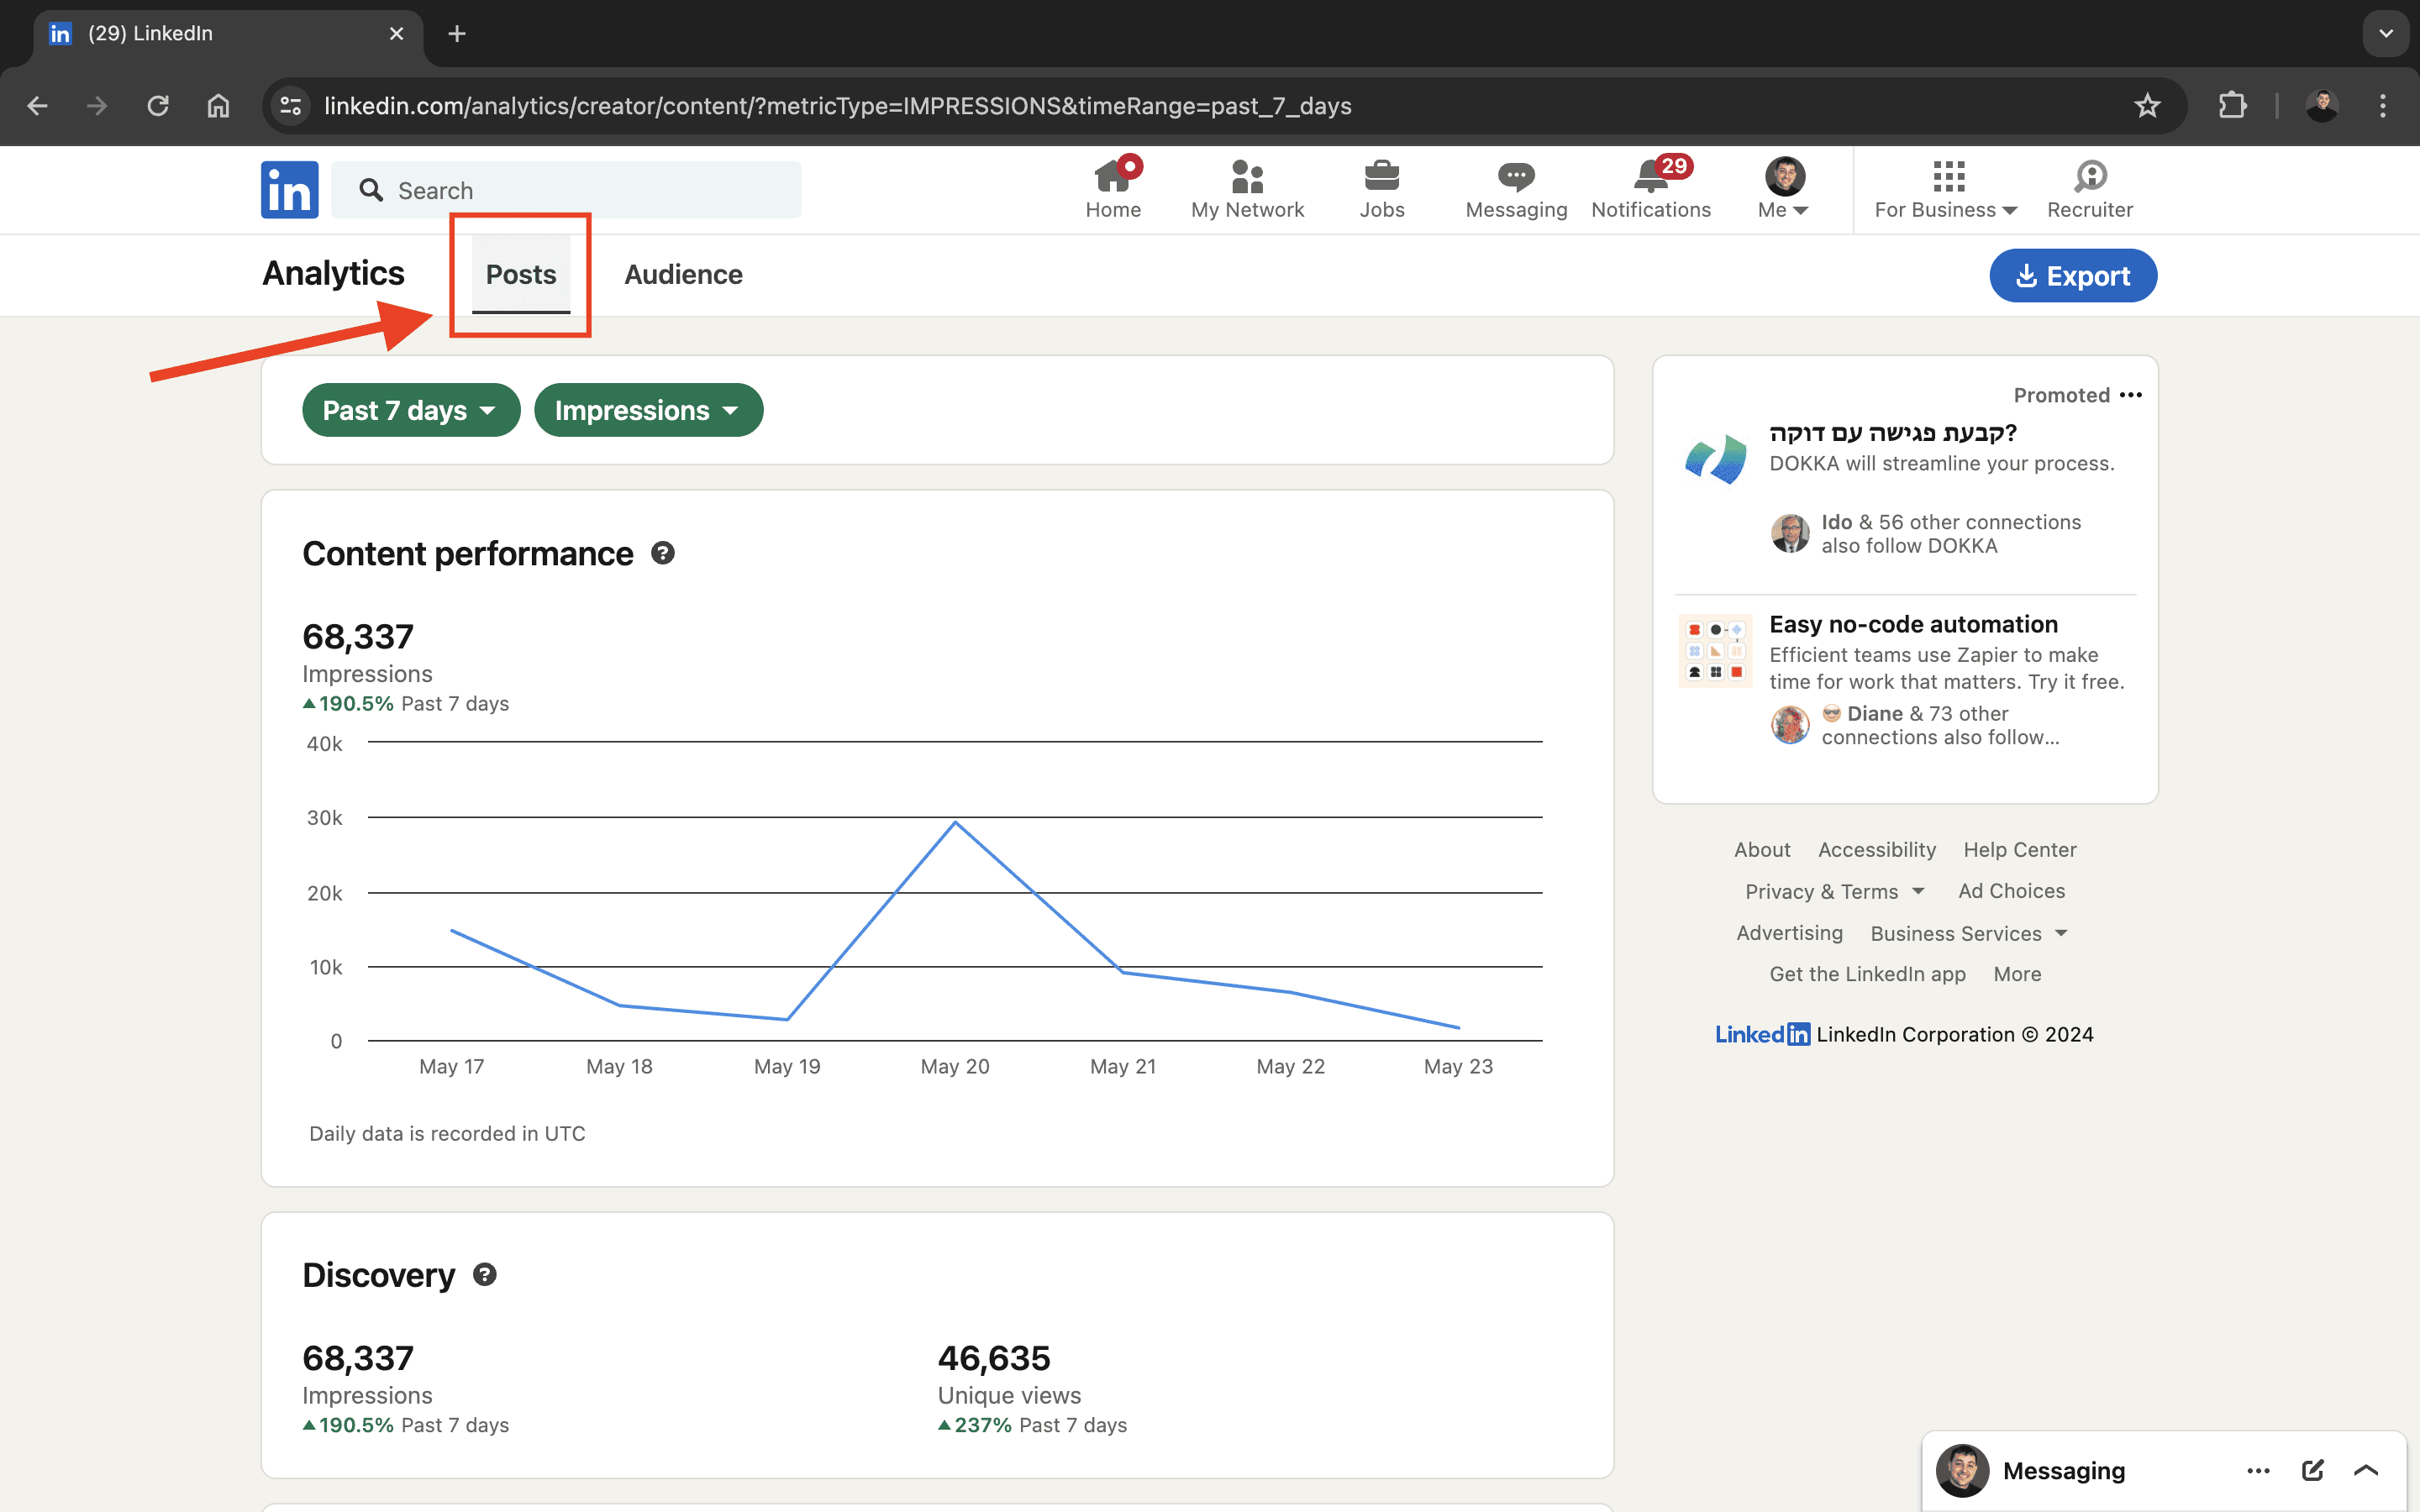
At the top, you’ll see two tabs:
Posts (overall post performance)
Audience (a breakdown of your followers)
For this article, we're going to focus on “Posts”. Click on it.
Explanation
Up top, you'll see two drop-downs:
Past 7 days
Impressions
By selecting different options for each, you can dictate what the graph below displays. The time period can be adjusted between five options: 7 days, 14 days, 28 days, 90 days, and 365 days, to provide an overview of your desired timeframe. Impressions can also be switched to Engagements. Let’s define each:
Impressions are the total number of times your posts have been seen. More specifically, it’s the amount of times your post has displayed over 50% of a LinkedIn user’s screen, for at least 300 milliseconds (0.3 seconds). To keep it simple, you can just think of impressions as views.
Engagements are a sum of the interactions your post has yielded, including reactions (likes), comments and reposts.
The graph displays the cumulative performance of your posts based on views and interactions over your chosen span of time. Paying attention to the spikes, you can interpret the days on which your content performed best.
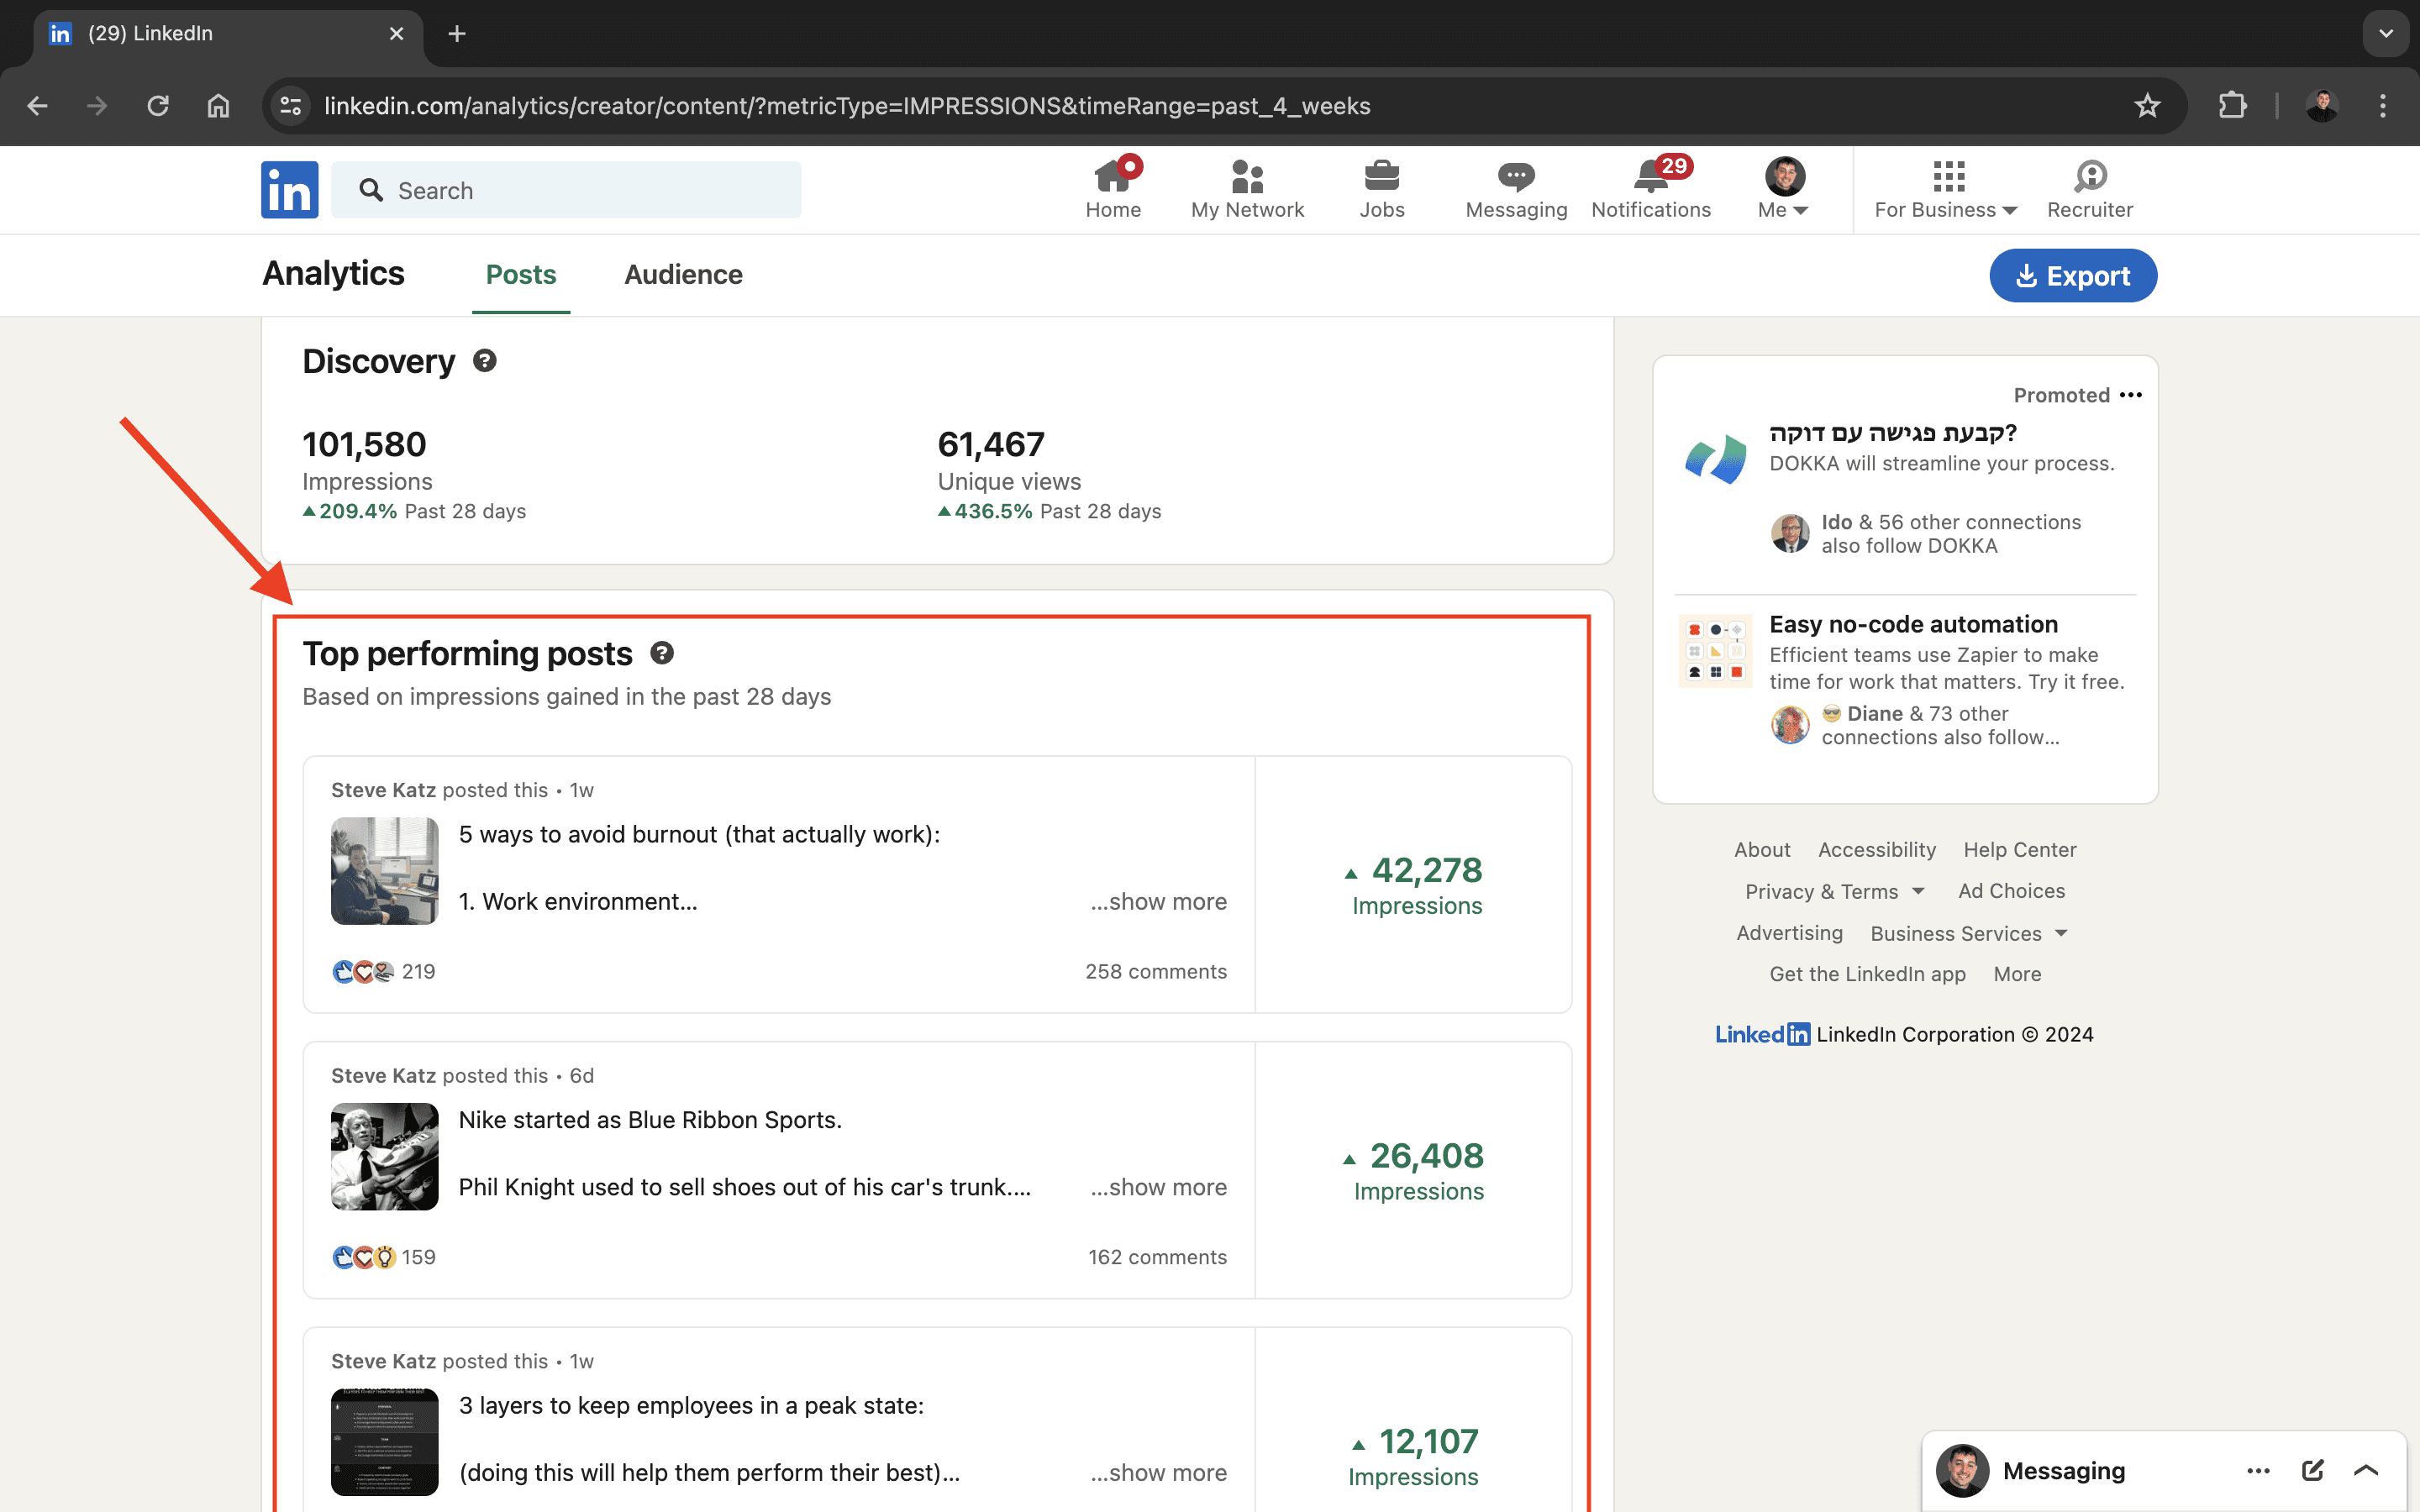
Top performing posts
Here’s where the fun starts. Now you can understand the performance of your individual posts and get an idea of what worked best. The posts will be either be shown by their total impressions or the sum of their engagements, in the selected timeframe. You can then click on any post to gain deeper insights.
We’ve now covered how to see which of your posts had generated the most impressions and engagements. Let’s now explore why they stood out, so you can do more of it.
Use The Ultimate Checklist (Free)
We’ve designed a light yet effective process you can add to your routine to maximize LinkedIn’s analytics and consistently improve the performance of your posts.
This actionable process consists of a checklist with 8 categories for examining your top-performing posts. The goal is to understand why they worked so that you can replicate success. We recommend repeating this process once every 10 posts.
Happy creating.
- - - - -
We're on a mission to empower people to thrive in their careers using profession-oriented content. Try Bright today, and start making LinkedIn content with a proper studio.


